Sampling
Archaeologists often use statistical sampling techniques (much like those used by election pollsters) to help decide where to survey or excavate. Sampling is often necessary because it would take too much time and money to investigate a whole site or region. Fortunately, we can still learn a great deal about an area of interest by investigating a smaller sample.
Rather than just exploring the areas that are easiest or seem to have the highest potential for containing archaeological materials (judgmental sampling), archaeologists typically use probabilistic sampling. The goal of probabilistic sampling is to draw a representative sample that accurately reflects the population as a whole. Probabilistic sampling helps to reduce the effect of the archaeologist’s own biases, and allows him/her to make inferences about the population based on the sample. Three common types of sampling strategies are: Simple Random, Systematic, and Stratified.
Sampling the Poverty Point site
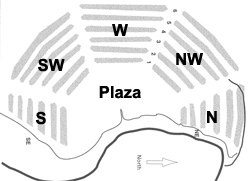 |
In the following pages you will learn more about these three strategies, while using actual data from the Poverty Point site. This data is based on the surface survey collections of Carl Alexander and Clarence Webb (avocational archaeologists), who collected at the site from the 1940s until the site was purchased by the state of Louisiana in 1972. Alexander and Webb were encouraged by archaeologist James Ford to record the provenience (location) of the artifacts they found. They therefore divided the site up into different sectors or areas, as shown on the map, and recorded the location for each artifact. |
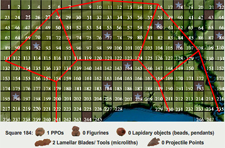
Clarence Webb {5} and archaeologist Jon Gibson {6} have summarized much of this data. So, we know, for example, how many poverty point objects (PPOs) were recovered from the south ridge area. For this exercise, we have arbitrarily assigned the data to equal sample units (squares) within each area. In other words, although the total objects recovered in each area matches the actual counts, the counts from each individual square are not accurate. In addition, we have fabricated some additional data for the plaza and area outside of the ridges, since these areas were not included in Alexander and Webb’s collection.
Alexander and Webb collected many different kinds of artifacts. We will focus on 5 types here:
- Poverty Point Objects (PPOs): cooking balls
- Clay Figurines
- Lapidary Objects: carved and polished stone objects, such as beads and pendants
- Lamellar Blades & Tools: microliths (“small stones”) such as perforators (probably used as drills or punches)
- Projectile Points
In the activities that follow, you will draw simple random, systematic, and stratified samples for the Poverty Point site. Since these simulations are based on actual surface collection data, and we have knowledge of the entire population (the site area), you will be able to compare how well the three sampling strategies did at estimating the actual population values.
 |
Interactive ActivityIn the following pages you will get practice at sampling, using data from the Poverty Point site. Download the sampling chart below to record your finds. The file is available as either an excel spreadsheet or pdf document. Each file contains 3 tables: “Raw Data,” “Summary,” and “Spatial Analysis.” It is suggested that you use the excel database, if possible, as the program will calculate the Summary and Spatial Analysis data for you (saving you time). |
 |
This page used information from entries 5 and 6 in the Bibliography.
